[]
Axes Calibration
Click points to select and use cursor keys to adjust positions. Use Shift+Arrow for faster movement. Click complete when finished.
Manual Extraction
Automatic Extraction
Mask
Width
Width
Color
Distance
Algorithm
Template
Point Groups
Current Tuple:
Current Group:
Overrides
⇪
RGB:
, ,
Dominant Colors:
Edit Image
Measure Distances
Measure Angles
Measure Area/Perimeter
Press Enter or Esc key to complete the polygon
Measure Path
Measure Closed Path
Detect Grid
Mask
Color
Background Mode
| Horizontal | |
| X% | |
| Vertical | |
| Y% |
WebPlotDigitizer 5.3
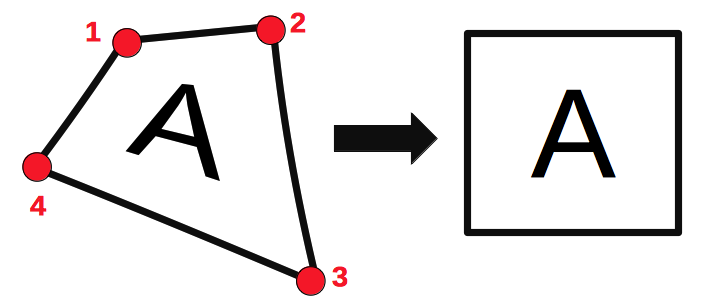
Image Editing
Click and drag to mark the crop region. Press Enter to complete cropping, Esc to cancel
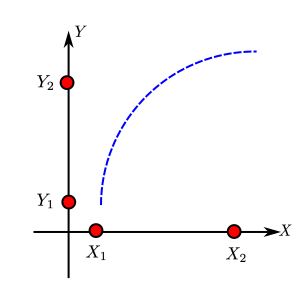
XY Axes Calibration
Specify four points: X1, X2 on X-axis and Y1, Y2 on Y-axis
| X-Axis | |
| X1 | |
| X2 | |
| Y-Axis | |
| Y1 | |
| Y2 | |
Refer to the expected input format for calibration values, especially for dates and exponentials.
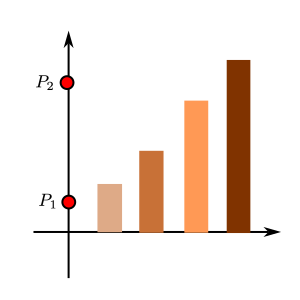
Bar Chart Calibration
Specify two points on the axes along the bars (P1, P2)
| Scale | |
| P1 | |
| P2 | |
Refer to the expected input format for calibration values, especially for dates and exponentials.
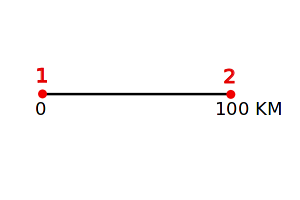
Map Calibration
Specify two points on the scale bar/reference dimension (P1, P2)
| Origin | |
| Scale | |
| Units |
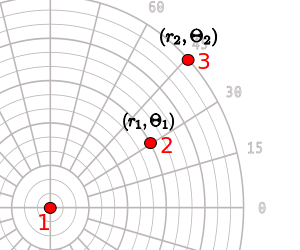
Polar Diagram Calibration
Specify origin and two known points (P1, P2)
| Radial | |
| Scale | |
| R1 | |
| R2 | |
| Angular | |
| Unit | |
| Orientation | |
| Θ1 | |
| Θ2 | |
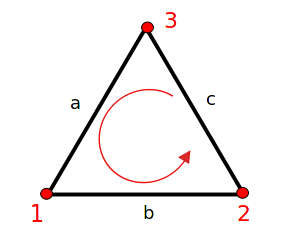
Ternary Diagram Calibration
Specify three points on corners of the ternary diagram (A, B, C)
| Scale | |

|
|

|
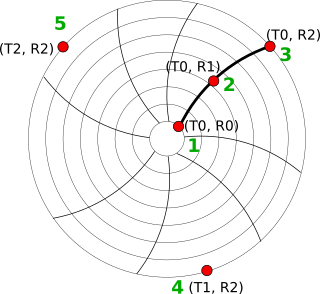
Circular Chart Calibration
Specify 5 points: 3 at different values, but same time. 2 at different times, but same value as R2
| Time | |
| Chart Start Time (T_Start) | |
| Time (T_0) | |
| Rotation Time | |
| Rotation Direction | |
| Value Range | |
| R0 | |
| R2 | |
Refer to the expected input format for calibration values, especially for dates and exponentials.